Select menu: Spread | Select | Highlight Rows Selected from Graph
You can highlight cells or rows within a spreadsheet using a selection of points made in a graph.

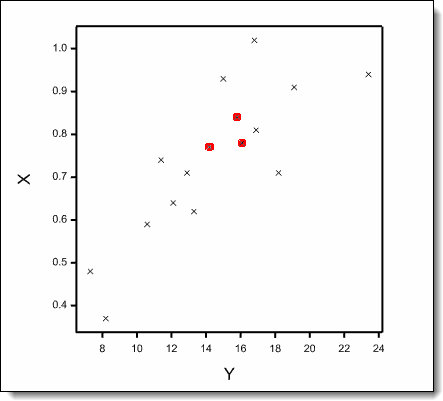
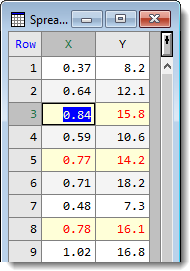
In the Graphics Viewer, select the points in the graph and copy them to the clipboard using the Data Information mode. In the spreadsheet you can then highlight the cells that correspond to these data points.
 |
 |
| Graph with data points selected using Data Information mode | Source spreadsheet with corresponding values highlighted |
- To select the data points, from the Graphics Viewer select Tools | Data Information Mode (shortcut keys Ctrl+D).
- Click the Point Selection button.

- Click the data points of interest then from the Graphics Viewer menu select Edit | Copy Data Information.
- Re-display your spreadsheet then select Spread | Select | Highlight Rows Selected From Graph.

- Set options as required then click OK.

The menu items Next Selected Cell or Next Coloured Cell in the Spread | Select menu can be used to move to the next coloured or selected cell within your spreadsheet.
| Highlighting method | Specifies the method used to highlight the points within the spreadsheet.
|
| Using | Specifies how the cells are to be selected or coloured.
|
| Keep current coloured cells | Any existing cell colouring made using the colour cells method will be retained when new points are highlighted in the spreadsheet. |